What Happened
President Trump extended the US-Iran ceasefire on Tuesday, April 21, keeping the two-week Pakistan-brokered truce alive past its scheduled Wednesday expiry. The U.S. naval blockade of Iranian ports remains in place, but the looming expiry is off the board. Equities took that as permission to repeat the ceasefire-rally trade: the S&P 500 and Nasdaq Composite closed at records, with the Nasdaq up 1.6% on the session.
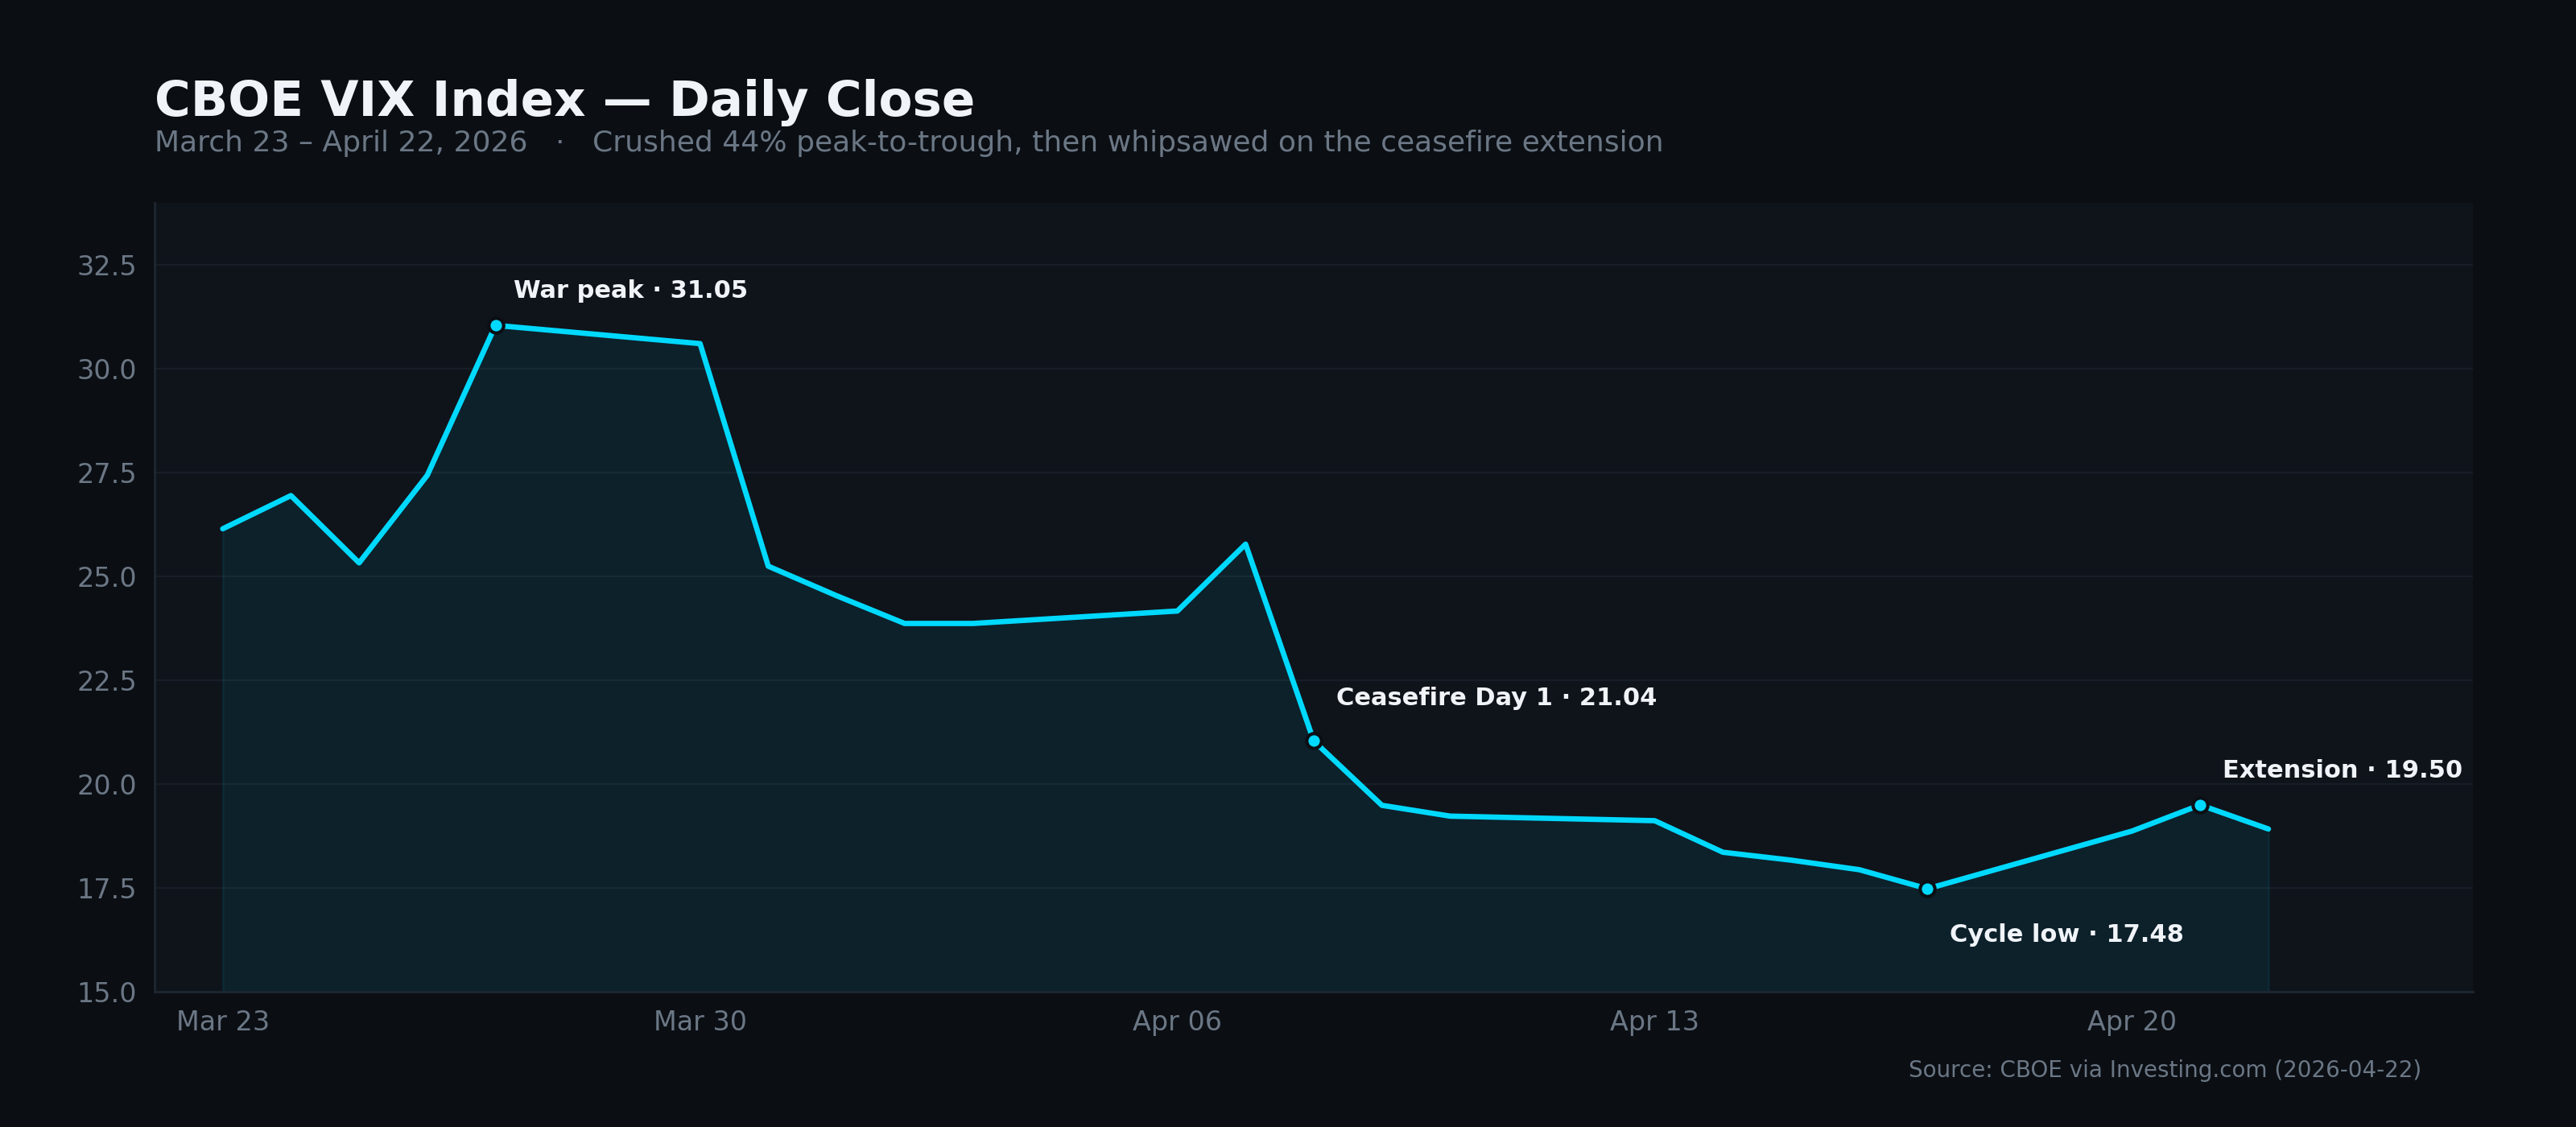
The more interesting number for futures traders is the fear gauge. The CBOE Volatility Index closed at 18.92 today, up from 19.50 yesterday and well off the 17.48 cycle low set on April 17 when Iran declared the Strait of Hormuz fully reopened. A month earlier — on March 27, during the hot phase of the war — the VIX had closed at 31.05, its highest settle of the conflict. The index has crushed 44% from that peak, with almost all of the damage done in a steady directional walk, not a single discrete event.
The Shape of the Move
The VIX didn't round-trip — it walked, then jumped, then whipsawed. Each of those three dynamics is a different regime for systematic strategies to trade.
- The walk (March 27 – April 17). A 44% peak-to-trough decline in the index over 15 trading sessions, driven by a two-step de-escalation: Pakistan-brokered mediation announced in late March, then the ceasefire itself beginning April 8. The April 8 session alone took the index from 25.78 to 21.04 — an 18% day-over-day compression on the announcement. The rest of the decline was mean-reversion at work: no single catalyst, just the systematic unwinding of the war premium.
- The jump (April 20). An 8% session gain back to an 18.87 close as oil-fueled fears gripped markets on US naval tanker stress and Iranian warnings about Persian Gulf shipping. WTI crude rose 6% the same session, partially reversing the post-ceasefire collapse.
- The whipsaw (April 21). A close at 19.50 after Trump's extension announcement — higher than the prior session, because the terms ( indefinite, contingent on a unified Iranian proposal, blockade intact ) priced in more uncertainty than the market had been holding at the cycle low.
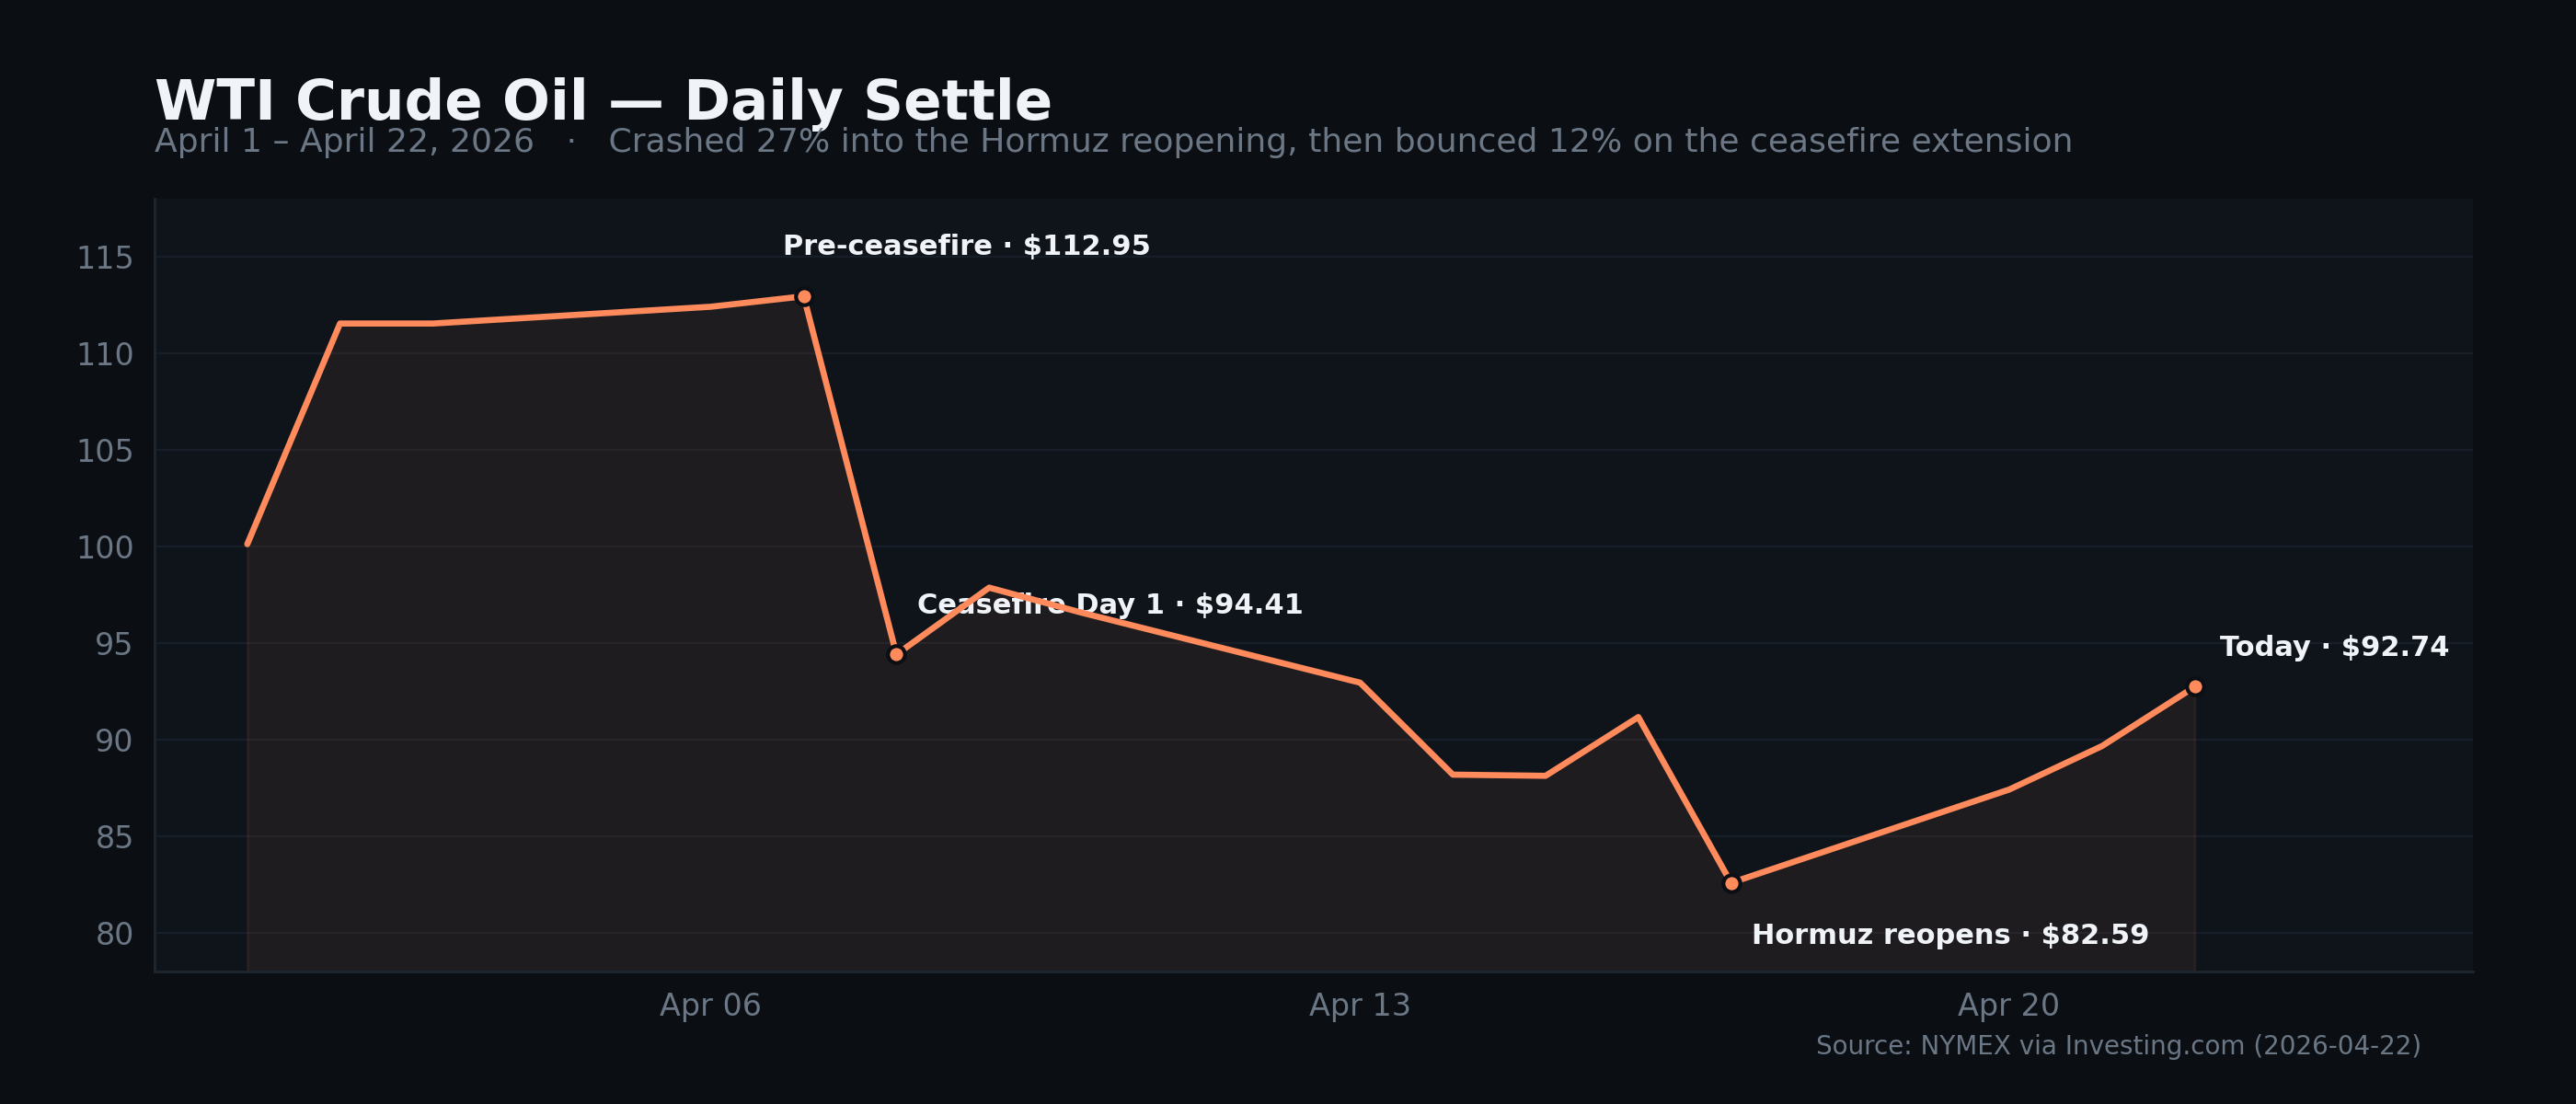
The crude oil complex traced the same pattern from the opposite side of the trade — crashing 27% from a pre-ceasefire settle of $112.95 (April 7) to a post-Hormuz low of $82.59 (April 17), then bouncing 12% to $92.74 today after Iran seized two ships in the Strait shortly after the extension.
Why These Regimes Break Systematic Assumptions
Most systematic futures strategies are trained on some version of the assumption that the return distribution is approximately stationary, or that regime shifts happen slowly enough that rolling-window recalibration keeps up. Marcos López de Prado has written at length about backtest overfitting under non-stationarity. The walk-forward VIX trading study published in 2024 found that even machine-learning models optimized on VIX futures term-structure features require frequent retraining to stay stable — and their worst drawdowns cluster around exactly the kind of news-driven jumps the market just traded.
Three families of systematic strategy responded differently to the last four weeks:
Trend-following (CTAs). Long-vol exposures that established during the March war run paid well into the 31.05 peak. The harder trade was the exit. A systematic trend-follower typically waits for a confirmed reversal before flipping short-vol, and the April 8 gap down (25.78 → 21.04) is exactly the kind of move that cuts through position-sizing rules before the signal has time to update. The Société Générale CTA Index tracks this dynamic in aggregate; binary-event months are historically among the worst-performing periods for managed futures.
Mean-reversion on index vol. Systems that fade extreme VIX reads by selling vol premium, or by buying ES on high-VIX prints, dominated this month's tape. A short-vol entry anywhere on the 28–31 plateau in late March is deep in the money by the April 17 low. Whether the strategy is "right" depends on the position-sizing discipline applied at entry — not the eventual correctness of the thesis.
Vol-targeting / risk-parity overlays. De-lever as realized vol expanded during the war run, re-lever as vol compressed after the ceasefire. Mechanically, they sold the peak and are now rebuying the compression — which is fine over long horizons and brutal during April-20-style jumps, because the exposure is always largest when the next surprise hits.
The common thread is that binary events shorten the effective sample. A strategy that normally uses, say, 60 days of rolling data to size risk suddenly has two or three sessions that dominate the window. The training distribution the strategy was built on is not the distribution it is currently trading.
The Term Structure Is the Honest Tell
Spot VIX is loud. The VIX futures term structure is where serious volatility traders actually read the market. In calm regimes, the VIX futures curve is in contango — longer-dated contracts trade above spot, reflecting the mean-reverting tendency of volatility and the supply of vol-selling strategies that persistently depress near-dated vol. Contango is the default state roughly 80% of the time since 2010.
Backwardation — when spot trades above longer-dated futures — is the regime signal. During stress, the curve inverts because the market prices realized vol today as higher than expected vol a month out. The longest recorded stretch of backwardation was 76 trading days during the 2011 European debt crisis; the COVID episode ran from late February 2020 through early May 2020.
For this cycle, the question is how fast the curve normalized as the war premium came out, and whether Tuesday's extension-day uptick in spot showed up in the curve. If front-month VIX futures hold a meaningful premium over the 3-month contract going into the Fed next week, the options market is telling you traders expect the statement to move the tape. If the curve is already back in full contango, spot is noise. Systematic vol strategies that read the curve — not just spot — are designed specifically to separate those two regimes.
FOMC Next Week Is the Next Binary Event
The Fed meets April 28–29. The CME FedWatch tool shows the overwhelming majority of fed funds futures pricing a hold at the current 3.50–3.75% target range. Because April is not a Summary of Economic Projections meeting — no updated dot plot, no revised growth or inflation forecasts — the information content of the decision collapses onto the statement language and the press conference.
From a regime-risk standpoint, that makes the meeting another binary event overlay on top of a market that just finished trading one. A "hawkish hold" that keeps yields and the dollar bid would undo a meaningful portion of the equity-ceasefire rally, because a non-trivial share of that rally is a duration re-pricing. A "dovish hold" that acknowledges the energy-price retrace as dis-inflationary would extend the move. Either outcome is a discrete regime event, not a continuous adjustment — which is exactly the kind of event systematic strategies trained on continuous data struggle to underwrite.
Update (April 30): The committee held the funds-rate target at 3.50–3.75% as expected, but the vote split 8-4 — the most dissents at a single FOMC meeting since October 1992. December rate-hike odds repriced from 0% to 9.1% intraday on the dissent split. The binary-event overlay played out exactly as the term-structure tape predicted.
Bottom Line
The March-to-April cycle is a case study in how modern futures markets process binary geopolitical risk: one long directional vol compression punctuated by two discrete whipsaws, with roughly nothing in between that looks like a normal vol regime. Strategies built on continuous return distributions are trading a market that currently lives on headlines. The honest signals — term-structure shape, realized-vs-implied-vol spreads, positioning data — still work. The spot VIX print, on its own, is the noisiest data point on the screen. And the cycle is not over — the next binary event is six days away.
Disclaimer: FalcoAlgo is a software product of Falco Systems LLC and is not a registered investment adviser. This article is for educational purposes only and does not constitute investment, trading, tax, or legal advice. Futures trading involves substantial risk of loss. Hypothetical performance results have inherent limitations and are not indicative of future results.


